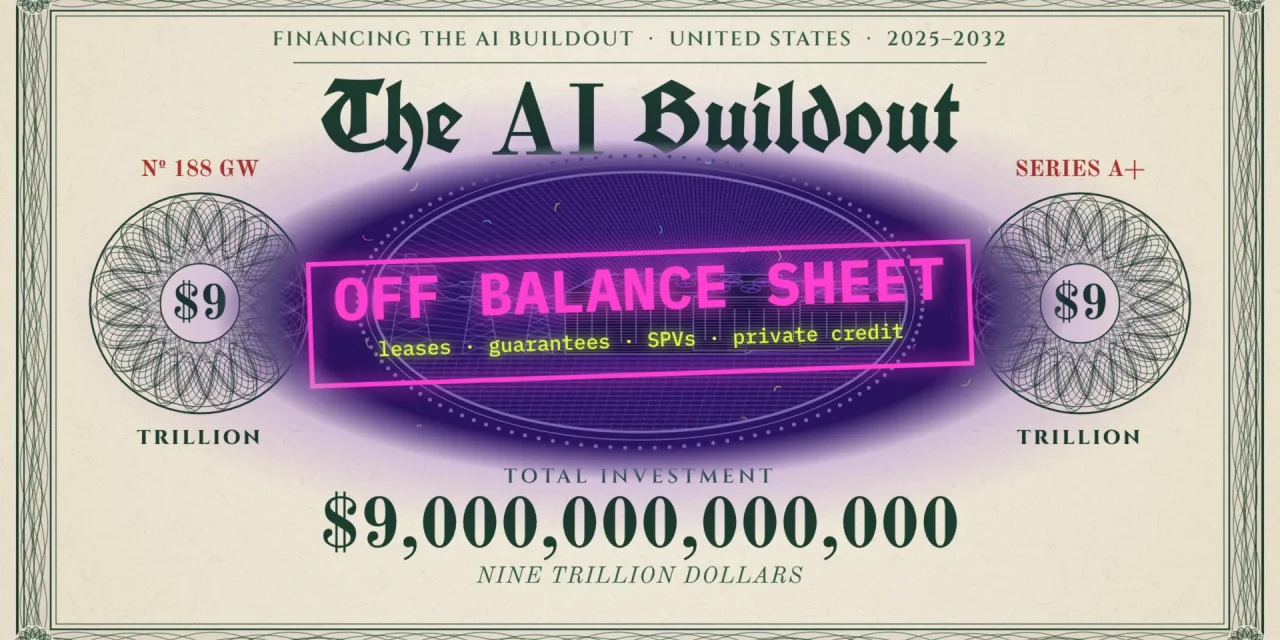
By 2032 the United States is on track to spend almost $9 trillion on AI data centres, power connections and chips. That is 3.2% of US GDP a year on average, more than the railroads ever absorbed. Belgian-born economist Stijn Van Nieuwerburgh of Columbia Business School put a number on it and then followed the money. His finding: the big tech firms can no longer pay for it out of their own cash, and a growing share of the debt and commitments sits outside their balance sheets. This article explains how those structures work, where the risks concentrate and why European pension funds and insurers have a stake in the outcome.
Who is Stijn Van Nieuwerburgh
Van Nieuwerburgh was born in Ghent in 1976, studied at Ghent University and earned his PhD at Stanford. He is a professor of real estate and finance at Columbia Business School and a former editor of The Review of Financial Studies. He became widely known for his work on the “urban doom loop”, the way empty offices after the pandemic eat into city finances.
That real estate background is what makes his view of AI different. He does not look at models or benchmarks but at buildings, substations, leases and loans. His paper Financing the AI Buildout is part of the Brookings Papers on Economic Activity and was presented at the Brookings conference on 25 September 2026. It is also available as an NBER working paper.
Why the headlines said $10.3 trillion
Most coverage in September quoted $10.3 trillion, 3.6% of GDP and 183 gigawatts. Those figures come from the conference draft of 4 September. The 11 October draft used here relies on newer project data from Cleanview (12 September instead of 23 July) and a revised scenario for which projects actually get built. It arrives at 188 GW of new capacity, $8.97 trillion and 3.22% of GDP a year. The message and the order of magnitude are unchanged, but anyone still quoting the earlier total is about a trillion dollars off.
The AI boom is a construction boom
AI is usually framed as a software revolution. In economic terms, Van Nieuwerburgh argues, the current phase is above all an investment cycle in physical capital. A modern AI rack can draw well over 100 kilowatts, against 5 to 10 kilowatts for a traditional CPU rack. That takes dedicated substations, high-voltage connections and liquid cooling.
He costs out a 200 MW training campus. It houses about 1,170 Nvidia GB300 NVL72 racks and uses as much electricity a year as roughly 170,000 American households. The bill comes to $8.2 billion, or about $41 billion per gigawatt:
- about $11 million per megawatt for the building, cooling and backup power;
- $2 million per megawatt for power infrastructure;
- $28 million per megawatt for GPU racks, networking, storage and integration.
Two thirds of the cost is hardware that ages fast. Keep that in mind, because it sits at the heart of the risk.
The Cleanview database lists 494 GW of US data centre projects that are planned or under construction. Including what already opened in 2025 and 2026, he assumes 188 GW is finished by 2032, 115 GW later and 213 GW never. At high utilisation, that new capacity alone would use about as much electricity as the entire US residential sector does today. Power is already the bottleneck, as Europe saw this summer when AI data centres strained the grid during a heat wave.
Compared with earlier American investment waves, it stands out. Railroads absorbed 2.24% of GDP a year between 1870 and 1890, highways 1.13% and the telecom and fibre boom around 2000 1.10%. The AI buildout averages 3.22%, peaking near 5% in 2028. He adds a caveat himself: a railway or a fibre cable lasts decades, a GPU three to six years. Each dollar leaves less durable capital behind.
Hyperscalers can no longer fund it from cash flow
Oracle, Microsoft, Amazon, Meta and Alphabet together spent about $97 billion on capital expenditure in 2020. In 2025 it was more than $400 billion, and for 2026 they are guiding to more than $800 billion. This year, for the first time, their combined investment exceeds the cash their operations generate.
That is the turning point of the paper. If you invest more than you earn, you need outside money. Morgan Stanley estimates that more than half of the roughly $2.9 trillion hyperscalers need for additional compute between 2025 and 2028 will come from external capital. On the debt side, private credit is the largest source at about $800 billion, followed by $200 billion in corporate bonds and $150 billion in structured finance.
The model is shifting. A hyperscaler used to build its own facility, pay for it from retained earnings or unsecured bonds and carry the risk. Now developers, REITs, infrastructure funds and private equity build or buy the campus and lease the capacity back. Banks, private credit funds and securitisation vehicles lend the money, and the same logic is moving from buildings to the GPUs themselves. Frontier labs such as OpenAI and Anthropic lack the credit profile to borrow at that scale, so they rent compute and lean on the hyperscalers’ balance sheets instead.
How Meta’s Hyperion deal works
The case Van Nieuwerburgh takes apart is Hyperion, Meta’s campus in Louisiana: about 2 gigawatts and $30 billion, one of the largest data centre projects to date. Step by step:
- Meta first owned the project outright, then sold an 80% stake to funds managed by Blue Owl Capital for about $2.5 billion.
- The joint venture, Beignet, raised $27 billion of debt in October 2025. S&P rated it A+, one notch below Meta. It was the largest single investment-grade corporate bond issue in US history.
- $27 billion of debt against a $30 billion asset is a debt-to-asset ratio of about 90%. Debt service is covered only 1.12 times.
- Meta leases the campus through five four-year leases from 2029 to 2049, when the bonds mature. At each renewal Meta may walk away.
- If it does, the campus is sold and Meta covers any shortfall against a pre-agreed minimum value. That is the residual value guarantee.
The clever part and the hard part are the same structure. Investors get long, predictable cash flows from a strong tenant. Meta keeps the option to leave after four years. And under current US GAAP, neither the future leases nor the residual value guarantee appear on Meta’s balance sheet until they take effect, even though one of the two will certainly happen.
It is not cheap. Beignet’s bonds yield 6.58%, at least a percentage point more than Meta would likely pay on its own unsecured debt. Over the life of the deal that is more than $5 billion in extra interest, ultimately embedded in Meta’s rent. What Meta buys is an asset-light profile: less reported capital intensity, less leverage and better credit metrics. In the Brookings podcast Van Nieuwerburgh summed up the fragility: “10% cash flow drop wipes out the equity.” With coverage of 1.12 there is little cushion.
Hyperion is a template, not an outlier. Sopaipilla, a 960 MW campus of Meta and Blackrock in El Paso, used a nearly identical structure for $12.3 billion of bonds in July 2026. IFR called the original deal “off-balance-sheet gymnastics”.
What the balance sheet does not show
Moody’s estimates that hyperscalers carry about $970 billion of lease commitments, of which roughly $660 billion are future leases not yet on balance sheet. Van Nieuwerburgh adds those obligations back for five firms (Alphabet, Meta, Microsoft, Oracle and CoreWeave), discounting future leases by 25%.
The gap is large. Combined, the five go from 22% to 50% of capital, and from 0.8 to 2.7 times EBITDA. Meta jumps from 24% to 59%. Oracle moves from 75% to 90% and from 4.3 to 12.1 times EBITDA. CoreWeave, the specialist AI cloud, reaches 20.8 times.
Credit markets seem to be noticing. Between November 2025 and July 2026, five-year credit default swap spreads widened for all five hyperscalers, Oracle’s from 119 to 206 basis points. And the market beta of listed data centre REITs rose from about 0.5 to about 1: they now move with the stock market rather than acting as a defensive asset.
Four risks the financing amplifies
The issue, Van Nieuwerburgh writes, is not that AI infrastructure carries risk but that the financing structure can transmit and amplify it. He names four.
- Concentration. Many campuses have a single tenant. If demand disappoints, a hyperscaler can keep its owned facilities busy and drop leased capacity first, pushing the loss onto outside owners.
- Obsolescence. Chips, cooling and designs change so quickly that a campus built for today’s GPUs can lose value long before the building wears out. More efficient models or inference at the edge could reduce demand for huge central campuses, which is exactly the bet behind chips like OpenAI’s Jalapeño. A bond running to 2049 against hardware with a six-year life is a maturity mismatch.
- Execution. Grid connections, transformers, permits, high-bandwidth memory and skilled labour are all scarce. The risk is not only higher costs but revenue that starts later, or never reaches the level the loan was underwritten on.
- Circularity. Chip designers, clouds, model developers, operators and financiers are tied together by contracts and stakes. Nvidia, for example, provides a 25% residual value guarantee on a $500 billion credit facility that lets customers buy Nvidia chips. A shock at one link travels through the chain.
How much AI has to be sold
The question underneath all of this is whether revenue follows. To earn a 10% return at a 50% operating margin, the new capacity must generate $3.55 trillion a year in revenue by 2032. That is 8.8% of projected US GDP in that year.
Translated into market prices, that is about $5.10 per GPU-hour at full utilisation, or $6.40 at 80%. That is close to what an Nvidia B200 rented for at the end of August 2026 ($6.07). So it is not implausible today. The question is whether those prices hold once 188 GW of new capacity comes online and competition intensifies.
Another benchmark: OpenAI and Anthropic together bring in roughly $100 billion in 2026. Reaching $3.55 trillion by 2032 requires about 81% growth a year. If IT equipment lasts three years instead of six, the requirement rises to about $5.7 trillion. Compare that with the scenarios in Anthropic’s outlook for AI and growth in 2030.
Is it a bubble?
He does not use the word. The paper says it would be “premature” to conclude that AI infrastructure already poses systemic risk comparable to earlier credit booms, and that financial distress is not imminent. Strong demand and high utilisation could carry the investment. His point is narrower and sharper: with uncertain demand, rapid technical change, execution bottlenecks and high leverage, a revision of expectations can hurt. And because the obligations are spread across joint ventures, leases, guarantees and vehicles, the correlation only becomes visible when things go wrong.
His policy ask is therefore measurement and disclosure, not prohibition. Who legally owns each asset, who bears demand, refinancing and residual value risk, how much sits with banks, insurers and private credit funds, and how concentrated is it in the same tenants? Off-balance-sheet finance can serve legitimate purposes, he notes, but the commitments should be transparent.
Why European investors should care
The campuses are in Texas and Louisiana, but the capital is global. Private credit funds raise much of their money from pension funds and insurers, including in Europe. In its Financial Stability Review of May 2026, the European Central Bank warned that an AI investment boom increasingly funded by private credit could hit euro area insurers and pension funds if returns fall short. In the stress scenario, as reported following the FT, pension funds lost 5 to 6% of assets and insurers around 4%, while bank losses stayed below 1.3% of equity. The Bank for International Settlements already described the hyperscalers’ vehicles as “shadow borrowing” in March.
There is a second lesson for Europe. Anyone who wants to build sovereign AI infrastructure here faces the same arithmetic: $41 billion per gigawatt, two thirds of it in hardware that ages quickly. How to finance that without making the risk invisible is a European question too, whether for hyperscaler campuses or for new hardware players like Tenstorrent.
Frequently asked questions
How much does a 1 GW AI data centre cost?
According to Van Nieuwerburgh, about $41 billion in 2025: $11 billion for the building and cooling, $2 billion for power infrastructure and $28 billion for IT equipment. He assumes that cost rises 4% a year.
What does off-balance-sheet financing mean for AI data centres?
The data centre sits in a separate entity that borrows on its own, while the tech company leases it. The debt is on that entity’s books, not the tenant’s. Future leases and guarantees only appear in the accounts once they take effect.
Why does Meta pay more interest through Hyperion?
Bondholders have no direct claim on Meta, only on the lease payments and the residual value guarantee. That extra risk and the long maturity cost at least a percentage point, in exchange for a lighter balance sheet for Meta.
Does the paper say the AI bubble will burst?
No. Van Nieuwerburgh calls it premature to speak of systemic risk. He describes the conditions under which losses could become correlated and spread, and asks for better measurement and transparency.
Follow the leases, not the models
A new model ships every week, but the real decisions about AI are being made in twenty-year lease contracts and bonds that run to 2049. If you want to know how solid the AI boom is, Van Nieuwerburgh suggests reading the fine print of those contracts rather than the next benchmark. It is also a nudge to supervisors and investors: the financial architecture of AI is being built now, and it is cheaper to make it transparent now than after the fact.