What is big data, how is it used, why is it essential for digital transformation and today’s data-driven economy and society, and how is big data (analytics) evolving?
Big data is characteristic for our digital economy, where leveraging actionable data and analytics has become vital as digitization continues with a deluge of data and a proliferation of data sources as a result.

- What is big data? Definitions and some history
- The Vs of big data
- The information opportunity of big data analytics
- Moving to high-value data and use cases
- More about Big Data and its evolutions and applications
- Smart data: beyond the volume and towards the reality
- Fast data: speed and agility for responsiveness
- Big data analytics: making smart decisions and predictions
- Unstructured data: adding meaning and value
- What makes data actionable?
- Big data in customer service
- Solving the Big Data challenge with artificial intelligence
- Data lakes for BDA
- Infographic: order from chaos
We are confronted with rapidly growing volumes of data and a wide variety of data types (structured data, unstructured data, semi-structured data, streaming data, etc.). And these can serve numerous goals and use cases across business processes, industries and applications if wisely used.
Big data is high-volume, -velocity, and -variety information assets that demand cost-effective, innovative forms of information processing for enhanced insight, decision making, and process automation. (Gartner)
Big data results from ongoing digitalization and, at the same time, drives digital innovation – and thus the creation of more data. A perfect example of how data volumes increase due to our digital behavior is the impact of the pandemic on data creation and data storage.
Businesses are overwhelmed with large volumes of data that aren’t easy to handle and manage. Data management challenges continue to be a hurdle for organizations to turn the data they have and can access into value faster, leading to the rise of DataOps.
What is big data? Definitions and some history
Before diving deeper into how organizations (can) use big data and how our ‘datasphere’ evolves, a few words on the origins, definitions, and famous Vs of big data.
Big data, in a way, means “all data” (in the context of your organization and its ecosystem). In a stricter sense, it points to large data sets that aren’t easy to process with what once were traditional methods.
Big data’ also points to the different forms of processing, analyzing, and managing those larger, ‘faster’ and more complex data sets and unlock the value they can offer. Moreover, one could say that, as a term ‘big data’ encapsulates big data analytics, data visualization, and the purposes for which big data techniques are used.
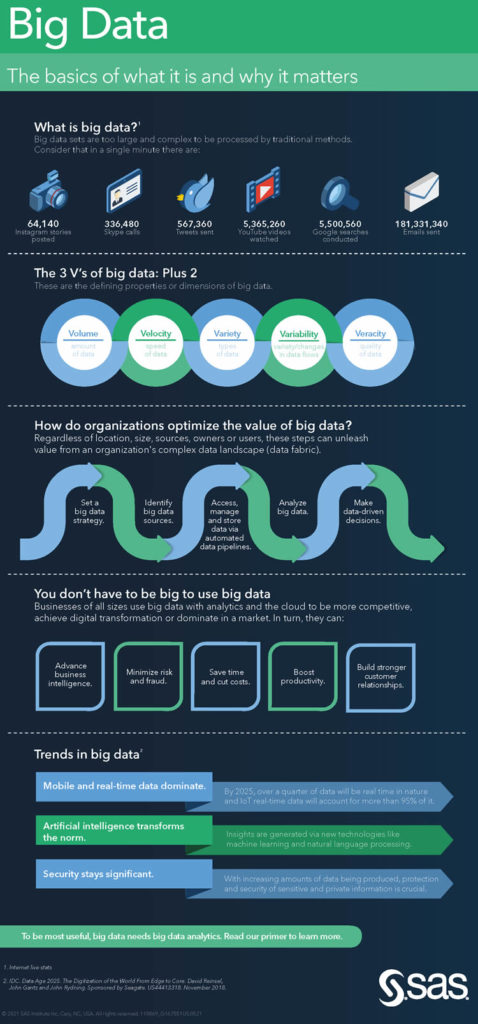
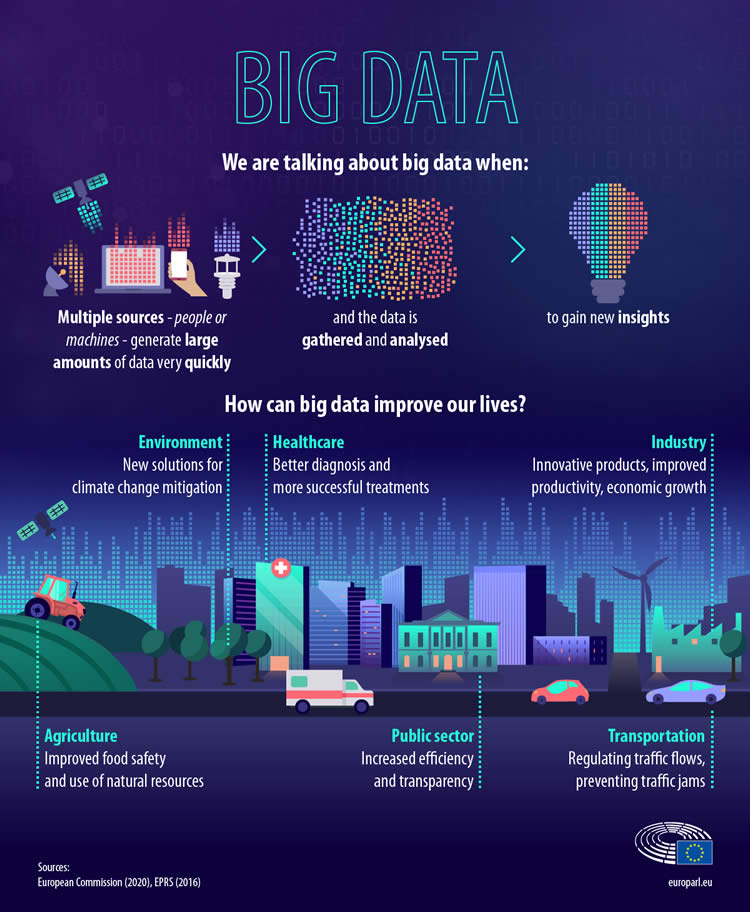
We talk about big data when multiple sources (people or machines) generate large amounts of data very quickly, and the data is gathered and analyzed to gain new insights (infographic below)
You will typically find four types of big data definitions:
- Some point to the characteristics of big data, which are known as the “Vs” with the original Vs being Volume, Variety, and Velocity (details below);
- Others focus on the fact that traditional data management methods and traditional relational databases don’t suffice for big data and explain the techniques and technologies that are needed/useful, such as advanced analytic techniques;
- Several definitions are more about the purpose and reasons why we use big data (analytics). Since we focus on business, we like those most personally;
- A mix of the above and more.
One definition of big data definitely could be that it’s a term (some would say buzzword) that’s so important that articles and book chapters have been written about who coined the term, when it was first used and how it is defined. But that doesn’t help you much (history matters, though).
When analyst Doug (Douglas) Laney described the 3 Vs as significant data management challenges for organizations in 2001, he unknowingly laid the foundation of most big data definitions ever since.
Since Doug worked for Meta Group/Gartner, we start with the research firm’s original definition of big data. Gartner’s definition was: “Big data is high-volume, -velocity and -variety information assets that demand cost-effective, innovative forms of information processing for enhanced insight and decision making.”
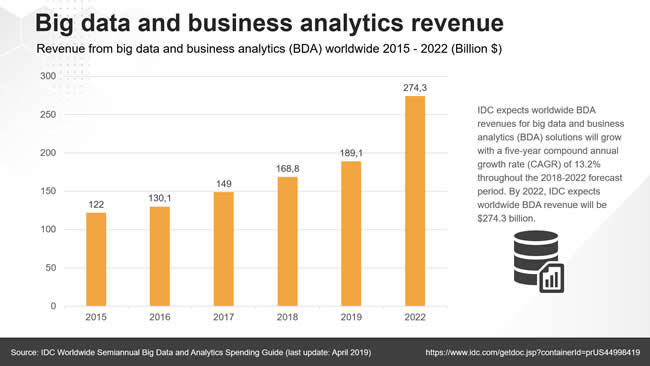
Worldwide spending on big data and business analytics (BDA) solutions is forecast to reach $215.7 billion in 2021, an increase of 10.1% over 2020. BDA spending will also gain strength over the next five years as the global economy recovers from the COVID-19 pandemic. The compound annual growth rate (CAGR) for global BDA spending over the 2021-2025 forecast period will be 12.8%. (IDC)
Since then, the definition has slightly changed, among others, with process automation as something big data enables.
At the time of writing this, Gartner’s full definition is: “Big data is high-volume, high-velocity and/or high-variety information assets that demand cost-effective, innovative forms of information processing that enable enhanced insight, decision making, and process automation.” Do notice that the 3 Vs are not the definition but a part of it. In other words: the tools to manage big data and purpose are at least as important.
In case you don’t like the Gartner definition of big data – and to close the matter of definitions – here are a few more:
Big data is a term used to describe the large amount of data in the networked, digitized, sensor-laden, information-driven world (NIST)
NIST (National Institute of Standards and Technology): “Big Data consists of extensive datasets – primarily in the characteristics of volume, velocity, variety, and/or variability – that require a scalable architecture for efficient storage, manipulation, and analysis.”
SAS: “Big data is a term that describes the large volume of data – both structured and unstructured – that inundates a business on a day-to-day basis. But it’s not the amount of data that’s important. It’s what organizations do with the data that matters. Big data can be analyzed for insights that lead to better decisions and strategic business moves.”
European Parliament (see infographic below): “Big data refers to collected data sets that are so large and complex that they require new technologies, such as artificial intelligence, to process. The data comes from many different sources. Often they are of the same type…but it can also be a combination. Technology enables this data to be collected very fast, in near real-time, and get analyzed to get new insights.”
Wikipedia: “Big data is a field that treats ways to analyze, systematically extract information from, or otherwise deal with data sets that are too large or complex to be dealt with by traditional data-processing application software.”
The Vs of big data
Enough about definitions and time to cover those Vs of big data. As mentioned, Doug Laney originally coined 3 Vs: volume, variety, and velocity. However, as time passed, more Vs were added. The infographic from SAS above and the one by IBM below respectively mention 5 Vs and 4 Vs.
Focus on the V of Volume – the datasphere
Before looking at each of them more in-depth, we inevitably need to talk a bit about the first one, volume, and the growth of our so-called datasphere.
Big data is pouring in from across the extended enterprise, the Internet, and third-party data sources. The staggering volume and diversity of the information mandates the use of frameworks for big data processing (Qubole)
With the datasphere, we refer to a service by research firm IDC, the ‘Global DataSphere,’ that quantifies and analyzes the amount of data created, captured, and replicated in any given year across the world (more below). In other words: a good indicator of volume (and more), certainly in combination with IDC’s ‘Global StorageSphere.’
Why a look at volume first? Because it’s what most people like to talk about and because increasing volumes pose a challenge (and are an opportunity) for organizations on many levels. The reality is that most organizations can’t follow. It’s not that you need to keep and leverage all data you (can) have access to.
On the other hand, you will have new use cases and applications whereby data you didn’t keep seemed valuable after all. It’s an actual balancing act. Storage and data protection and management aren’t cheap, but missed opportunities can be costly too. Anyway, volumes grow at staggering rates. So, let’s look at that first.
Our ‘datasphere‘ isn’t exactly about to shrink. Well, on the contrary. With the Internet of Things (IoT), digital transformation, Industry 4.0, and emerging technologies impacting all areas of society, business, and our lives, it grows even faster.
Some technologies (e.g., 5G) will accelerate the volumes of data out there even more. The increasing adoption of anything digital during the pandemic certainly is an accelerator too as are evolutions such as the future of work. And so are organizations’ plans, from businesses to governments, to invest even more in digital, and thus data.
Data has become a business asset beyond belief for quite some time now. Or, as the old saying goes, it’s the new currency/oil/gold (whatever you prefer). And we all realize it’s indeed worth a lot.
More than 5 billion consumers interact with data every day – by 2025, that number will be 6 billion, or 75% of the world’s population. In 2025, each connected person will have at least one data interaction every 18 seconds (Data Age 2025)
It’s easy to see why we are fascinated with volume and variety if you realize how much data there is (the numbers change all the time, it truly is exponential) and in how many ways, formats, and shapes it comes from a variety of sources.
Consider the data on the Web, transaction logs, social data, streaming data in IoT, and the data extracted from gazillions of digitized documents. Consider several other types of unstructured data such as email and text messages, data generated across numerous applications (ERP, CRM, supply chain management systems, anything in the broadest scope of suppliers and business process systems, vertical applications such as building management systems), geolocation data and, increasingly, data from sensors and other data-generating devices and components in the realm of cyber-physical convergence.
Just imagine: per the ‘Data Age 2025’ report, by 2025, the global datasphere will grow to 175 zettabytes (from 33 in 2018), with IoT devices expected to create over 90 zettabytes of data. That is, well, huge.
And the impact of the pandemic? In March 2021, research firm IDC announced that “the amount of data created and replicated experienced unusually high growth in 2020 due to the dramatic increase in the number of people working, learning, and entertaining themselves from home”.
In total, in 2020, around 64.2 zettabytes of data were created or replicated. Per IDC’s Dave Reinsel, the “amount of digital data created over the next five years will be greater than twice the amount of data created since the advent of digital storage.”
IDC now forecasts that global data creation and replication will grow at 23 percent per year over the 2020-2025 forecast period.
The big data initiative is a part of a larger funded initiative. This will become more common as the term “big data” fades away, and dealing with larger datasets and multiple data types continues to be the norm. (Nick Heudecker-Gartner)
And the explosion still has to start: businesses and governments push the digital agenda for business and cyber resilience that has become a priority with the pandemic. As a consequence of the pandemic, e-commerce booms, and many people used digital services across a range of applications for the first time. This will have a lasting impact (also think about hybrid working models, investments in smart office technologies, etc.). Moreover, soon consumers will dispose of ‘real’ 5G devices, and sensors are massively deployed to enable the ‘remote everything’ wishes in many areas such as smart manufacturing.
IoT data already represent the fastest-growing data segment, followed by social media per the mentioned 2021 IDC findings. And this is without the data generated by video surveillance cameras, networks of AI-supported security cameras being a primary 5G use case with lots of data. Last but not least, data-intensive applications such as digital twins and AR/VR are becoming mainstream in several environments. So, yes, the volumes are enormous.
The continuous growth of the datasphere and big data has an important impact on how data gets analyzed whereby the edge (edge computing) plays an increasing role and public cloud becomes the core.
The increase of large and complex data required a different approach in the ‘fast’ context of a real-time economy where rapid access to complex data and information matters more than ever.
The 3 Vs, 4 Vs, 5 Vs and more Vs of big data
Admittedly that was quite a bit on the volume aspect. However, as this is a growing guide to big data, expect more about the other Vs too, at times a bit technical. So, a summary of what they are about before looking at big data in practice.
As the infographic by SAS above shows (3+2), and as mentioned, the original 3Vs are volume, variety, and velocity. IBM (see graphic below) added a fourth one in its view: ‘veracity.’
SAS opted to add variability and veracity instead. Others went for six (the original ones + value + veracity + variability). You can also find the 7Vs of big data or, if you like it big: some went for ten, among others adding visualization and vulnerability. We’ll stick to 5 and might talk about the others later.
Volume
Volume strictly refers to the size of the dataset (with extensive datasets as one of the – original – characteristics). However, you’ll often notice that it is used to the mentioned growth of data volumes in a sense of all the data that’s being created, replicated, etc. The sheer volume of data and information that gets created whereby we mainly talk infrastructure, processing and management of big data, be it in a selective way.
Variety
On top of the data produced in a broad digital context, regardless of business function, societal area or systems, there is a huge increase in data created on more specific levels. Variety is about the many types of data, being structured, unstructured and everything in between (semi-structured).
The 3Vs by Douglas Laney (volume, variety and velocity) are three defining aspects of big data.
Velocity
Velocity refers to the rate of data flow. Velocity is about where analysis, action and also fast capture, processing and understanding happen and where we also look at the speed and mechanisms at which large amounts of data can be processed for increasingly near-time or real-time outcomes, often leading to the need of fast data.
Veracity
Veracity has everything to do with accuracy which from a decision and intelligence viewpoint becomes certainty and the degree in which we can trust upon the data to do what we need/want to do. Indeed about good old GIGO (garbage in, garbage out). Or as NIST puts it: Veracity refers to the completeness and accuracy of the data and relates to the vernacular “garbage-in, garbage-out” description for data quality issues in existence for a long time.
Value
We add value to that as it’s about the goal, the outcome, the prioritization and the overall value and relevance created in data-intensive applications, whereby the value lies in the eye of the beholder and the stakeholder and never or rarely in the volume dimension. Per NIST, value refers to the inherent wealth, economic and social, embedded in any dataset. As long as you don’t call it the new oil.
Big data comes from many different sources. Often they are of the same type, for example, GPS data from millions of Firms in the professional services industry are utilizing Big Data and analytics to support their 360-degree customer and client management efforts, as well as advanced project management initiatives. Banks are using BDA solutions to improve customer onboarding while simultaneously automating business operations and detecting and preventing fraud (Jessica Goepfert, IDC)
The information opportunity of big data analytics
Data as such is meaningless, as is volume. Thanks to big data analytics (BDA), artificial intelligence, and more, we can focus on what matters: meaning, insights, value, actionable data, actionable intelligence, a goal, and the ways to get there and move from data to decisions and actions (the DIKW model).
Just as information chaos is about information opportunity, big data chaos is about opportunity and purpose. On top of that, the beauty of big data is that it doesn’t strictly follow the classic rules of data and information processes and even perfectly dumb data can lead to great results as Greg Satell explains on Forbes.
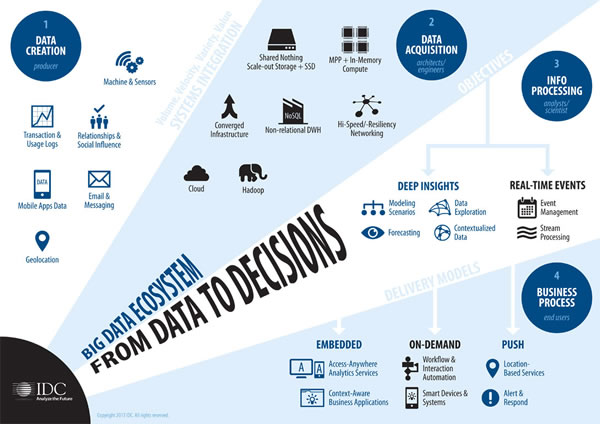
The renewed attention for big data in recent years was caused by a combination of open source technologies to store and manipulate data and the increasing volume of data. Add to that the various other 3rd platform technologies, of which big data analytics is part such as cloud computing, mobile and additional ‘accelerators’ such as IoT and it becomes clear why big data gained far more than just some renewed attention but led to a broadening ecosystem as depicted below.
Today, and certainly here, we look at the business, intelligence, decision and value/opportunity perspective. From volume to value (what data do we need to create which benefit) and from chaos to mining and meaning, putting the emphasis on data analytics, insights and action.
Unlike many other areas of the IT services market, big data and analytics services continued to grow in 2020 as organizations relied on data insights and intelligent automation solutions to survive the COVID-19 pandemic (Jennifer Hamel, IDC)
The importance of big data and more importantly, the intelligence, analytics, interpretation, combination and value smart organizations derive from a ‘right data’ and ‘relevance’ perspective will be driving the ways organizations work and impact recruitment and skills priorities.
The winners will understand the Value instead of just the technology and that requires data analysts but also executives and practitioners in many functions that need to acquire an analytical, let alone digital, mindset. A huge challenge, certainly in domains such as marketing and management.
Moving to high-value data and use cases
Organizations have been focusing (far too) long on the volume dimension.
Volumes were and are staggering and getting all that data into data lakes hasn’t been easy and still isn’t (more about data lakes below, for now see it as an environment where lots of data are gathered and can be analyzed). At a certain point in time we even started talking about data swamps instead of data lakes. You can imagine what that means: plenty of data coming in from plenty of (ever more) sources and systems, leading to muddy waters (not the artist).
Having lots of data is one thing, having high-quality data is another and leveraging high-value data for high-value goals (what comes out of the water so to speak) is again another ballgame.
Fortunately, organizations started leveraging Big Data in smarter and more meaningful ways. Although data lakes continue to grow and there is a shift in Big Data processing towards cloud and high-value data use cases.
Big data comes from many different sources. Often they are of the same type, for example, GPS data from millions of mobile phones is used to mitigate traffic jams; but it can also be a combination, such as health records and patients’ app use. Technology enables this data to be collected very fast, in near real time, and get analyzed to get new insights. (EP)
This is happening in many areas. According to Qubole, Big Data is being used across a wide and growing spectrum of departments and functions and business processes receiving most value from big data (in descending order of importance based upon the percentage of respondents in the survey for the report) include customer service, IT planning, sales, finance, resource planning, IT issue response, marketing, HR and workplace, and supply chain.
In other words: pretty much all business processes. As mentioned in an article on some takeaways from the report, the shift to the cloud leads to an expansion of machine learning programs (machine learning or ML is a field of artificial intelligence) in which enhancing cybersecurity, customer experience optimization and predictive maintenance, a top Industry 4.0 use case, stick out.
More departments, more functions, more use cases, more goals and hopefully/especially more focus on creating value and smart actions and decisions: in the end it’s what BDA and, let’s face it, most digital transformation projects and enabling technologies such as artificial intelligence, IoT and so on are all about.
Big data used to mean data that a single machine was unable to handle. Now it has become a buzzword to mean anything related to data analytics or visualization (Ryan Swanstrom)
More about Big Data and its evolutions and applications
Smart data: beyond the volume and towards the reality
With increasing volumes of mainly unstructured data comes a challenge of noise within the sheer volume aspect.
In order to achieve business outcomes and practical outcomes to improve business, serve customer betters, enhance marketing optimization or respond to any kind of business challenge that can be improved using data, we need smart data whereby the focus shifts from volume to value.
Fast data: speed and agility for responsiveness
In order to react and pro-act, speed is of the utmost importance.
However, how do you move from the – mainly unstructured – data avalanche that big data really is to the speed you need in a real-time economy? Fast data is one of the answers in times when customer-adaptiveness is key to maintain relevance.
Big data analytics: making smart decisions and predictions
As anyone who has ever worked with data, even before we started talking about big data, analytics are what matters.
Without analytics there is no action or outcome. While smart data are all about value, they go hand in hand with big data analytics. In fact, BDA, and more specifically predictive analytics, was the first technology to reach the plateau of productivity in Gartner’s hype cycle.
Unstructured data: adding meaning and value
The largest and fastest growing form of information in the Big Data landscape is what we call unstructured data or unstructured information. Coming from a variety of sources it adds to the vast and increasingly diverse data and information universe.
To turn the vast opportunities in unstructured data and information (ranging from text files and social data to the body text of an email), meaning and context needs to be derived. This is what cognitive computing enables: seeing patterns, extracting meaning and adding a “why” to the “how” of data.
What makes data actionable?
Without intelligence, meaning and purpose data can’t be made actionable in the context of Big Data with ever more data/information sources, formats and types.
Moreover, there are several aspects of data which are needed in order to make it actionable at all. Whether it concerns Big Data or any other type of data, actionable data for starters is accurate: the data elements are correct, legible and valid. A second aspect is accessibility, which comes with several modalities as well. Other dimensions include liquidity, quality and organization.
Big data in customer service
Today’s customers expect good customer experience and data management plays a big role in it.
Making sense of data from a customer service and customer experience perspective requires an integrated and omni-channel approach whereby the sheer volume of information and data sources regarding customers, interactions and transactions, needs to be turned in sense for the customer who expects consistent and seamless experiences, among others from a service perspective.
Solving the Big Data challenge with artificial intelligence
Roland Simonis explains how artificial intelligence is used for Intelligent Document Recognition and the unstructured information and big data challenges.
Among the AI methods he covers are semantic understanding and statistical clustering, along with the application of the AI model to incoming information for classification, recognition, routing and, last but not least, the self-learning mechanism.
Data lakes for BDA
Traditional methods of dealing with ever growing volumes and variety of data didn’t do anymore. That’s where data lakes came in.
Data lakes are repositories where organizations strategically gather and store all the data they need to analyze in order to reach a specific goal. The nature and format of the data nor data source doesn’t matter in this regard: semi-structured, structured, unstructured, anything goes. The data lake is what organizations need for BDA in a mixed environment of data. However, there are challenges to this model as well where Hadoop is a well-known solutions player and data lakes as we know them are not a universal answer for all analytics needs.
Infographic: order from chaos
While, as mentioned, the predictions often have change by the time they are published, below is a rather nice infographic from the people at Visual Capitalist which, on top of data, also shows some cases of how it gets used in real life.
Check out the ‘creating order from chaos’ infographic below or see it on Visual Capitalist for a wider version.

Top image: Shutterstock – Copyright: Melpomene – All other images are the property of their respective mentioned owners.