Internet of Things spending globally should reach $772.5 billion in 2018. That is lower than forecasted previously. Also for the next years IoT spending is expected to be lower. A look at the numbers in context, some patterns and Internet of Things spending shifts for the next years.
Although the number of large-scale IoT projects has been growing and there are clear increases in several areas of the overall IoT stack and the IT infrastructure that needs to sustain ongoing IoT deployment and evolutions, spending on IoT hardware, software, services and connectivity is growing slower than has been forecasted earlier.
Also in 2018 IoT spending is poised to be lower than was predicted previously. Obviously it takes forecasts from one and the same research company to be able to come to that conclusion and in this case we look at the most recent data from IDC.
IoT hardware will be the largest IoT technology spending category in 2018 with $239 billion going largely toward modules and sensors along with some spending on infrastructure and security (IDC)
It’s of course not the first time that analysts need to revise and lower forecasted numbers. Yet, the data leave little room for interpretation although the ‘why’ behind the data matters most. Before drawing any conclusions one must look at all industries, use cases and elements that could explain this phenomenon (on top of the fact that forecasts remain forecasts).

Some examples are, for instance,
- lower spending in specific industries, technology types and use cases;
- the impact a lack of available skills in the market where there is a fight for IoT talent;
- the fact that in the consumer IoT space we are still waiting for some next generations of types of products and solutions that make consumers reach to their wallets (although consumer IoT should do very well in 2018, with smart home automation leading);
- the fact that many organizations have put money aside for other priorities (e.g. for geopolitical uncertainties in some countries or to be ready for the EU’s GDPR whereby IoT projects and solutions that include the processing of personal data of EU citizens require very particular measures and require far more attention and preparation);
- security challenges that remain a hurdle for investments, also in industrial markets were attacks on connected industrial systems are on the rise as well and the declining costs of hardware, to name just a few,
- other IoT barriers, including privacy concerns, implementation issues, technological fragmentation and so forth,
- a high focus on operational benefits, automation and immediate internal goals by many organizations whereby customer-facing applications and more transformational goals for now are less sought after and cost savings prevail.
Internet of Things spending 2018: dynamics and leading industries
The overall dynamics in the market haven’t changed that much. IoT in manufacturing remains number one from the IoT spending perspective, followed by transportation and utilities.
It has been so for several years now and in 2018 it will be no different (keeping in mind that we’re talking about spending and spending patterns across the globe).
As was also forecasted the consumer IoT segment, which of course covers many different types of solutions, just as that big umbrella term IoT covers myriad use cases per industry, is poised to hold the fourth position in 2018 from that same spending perspective. Smart homes (including home automation), security and smart appliances lead the pack here.
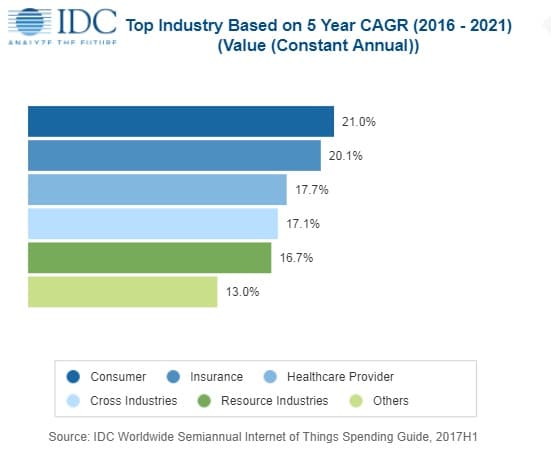
The manufacturing industry is expected to spend $189 billion on IoT solutions in 2018, continuing to make IoT in manufacturing by far the largest spending category. Consumer IoT, fourth in 2018, has the highest CAGR until 2021, with strong spending growth for smart appliances, and an overall CAGR of 21%
Then there is the fact that there are several so-called cross-industry IoT use cases where spending is higher (and where there are slight changes as to which use cases exactly and expected CAGR) and, last but not least, the fact that IoT hardware for now (2018) is the largest IoT technology category, spending-wise.
The coming Internet of Things spending shift: IoT software and IoT services taking the lead
The dominance of IoT hardware in the bigger Internet of Things spending picture is about to shift with more focus on services and software over the next few years.
By 2021, IoT spending relating to software and services should account for 55 percent of all IoT spending.
It’s clear that when starting with IoT projects that are mature and scalable, IoT hardware is a first investment area. If it isn’t connected it can’t lead to the data, analysis and so forth. Just compare with the levels of the mentioned IoT stack or even with the three types of 4IR technologies we covered in the scope of the fourth industrial revolution and 4IR patent applications, where IoT (particularly Industrial IoT) obviously takes center stage, (and after all it still is in the industrial markets of Industry 4.0 and smart manufacturing, transportation and Logistics 4.0 and utilities, including Energy 4.0, that most investments happen).
By 2021, more than 55% of spending on IoT projects will be for software and services. Software creates the foundation upon which IoT applications and use cases can be realized. However, it is the services that help bring all the technology elements together to create a comprehensive solution that will benefit organizations and help them achieve a quicker time to value (Carrie MacGillivray, IDC)
While in several areas of IoT hardware, costs keep declining (one of the reasons why IoT hardware vendors are looking at the monetization of IoT data) at the same time ever smarter, stronger and more advanced components pop up. Think smarter and wireless transducers, think new chips and also think new technologies and thus also hardware components enabling better, stronger and new connectivity solutions.
At the same time, as there is a gradual shift to edge computing and analysis close to that edge, new hardware (and software) capabilities also bring more expensive devices. Those robust Industrial IoT gateways are just one example. As covered in a previous post, the growth of IoT data increase and gradual move to the edge does come with shifts in patterns regarding the IT infrastructure needed for IoT.
The largest portion of IoT hardware spending in 2018, however, seems not to be for infrastructure or security but for modules and sensors.
Software for now ranks second led by application software along with analytics software, IoT platforms, and security software).
Internet of Things spending 2018: the numbers in context
All this being said, time for some numbers. When IDC published the forecasts for 2018 (with data for the years beyond), most media focused on the fact that, according to IDC, spending on the Internet of Things globally will reach $772.5 billion in 2018.
That is still a two-digit increase (14.6 percent) over 2017 spending, which is roundabout $674 billion.
When comparing with previous forecasts on Internet of Things spending these are indeed lower numbers than previously expected.
- A previous IDC forecast we covered early 2017 saw IoT spending reach $737 billion in 2016 and $1.29 trillion in 2020.
- Another IDC forecast, from the Summer of 2017, which we also covered, expected IoT spending to reach just over $800 billion in 2017 and nearly $1.4 trillion by 2021.
- The latest update, which we tackle here, however, shows that:
- the number for 2017 isn’t attained,
- that the forecasts for 2018 are lower than the previously forecasted numbers for 2017 and only slightly higher than what was expected for 2016,
- that it is now expected we’ll reach the $1 trillion mark in IoT spending in 2020 with forecasts for 2021 lowered and expected to reach $1.1 trillion in 2021.
More on the various mentioned industries and the industries with the highest expected Compound Annual Growth Rate (CAGR), as well as the underlying dynamics in the market and the evolutions in key cross-industry IoT use cases coming.
The future: industries displaying highest growth rates
The graphic below already shows which industries (including cross-industry IoT use cases, mentioned as if they were an industry) are expected to show highest CAGR.
By way of context and comparison: IDC expects an overall CAGR of 14.4% through the 2017-2021 period in which a major shift will also be the beforementioned relative increase of spending on IoT software and services, compared with the 2018 IoT leader in terms of spending, IoT hardware.
As you can see the consumer (IoT) industry is expected to display highest CAGR, followed by insurance, healthcare providers (more on IoT and healthcare providers), cross-industry use cases and resource industries.

If one or several of those for one or the other reason don’t grow as expected overall forecasts are affected. And that also has played in the revision of the forecasts over the last few years.
Top image: Shutterstock – Copyright: iDEAR Replay – All other images are the property of their respective mentioned owners.

