What are the main use cases, industries, cross-industry segments and regions driving investments in the IoT in 2017 and in the period until 2021?
In previous entries we summarized some major trends, technologies, market data and evolutions for the Internet of Things in 2017, at the main drivers of investment in the industrial Internet or Industry 4.0 for 2017 and at the spending patterns and drivers (IoT use cases, industries etc.) with regards to IoT investments, the latter based upon 2017’s first Worldwide Semiannual Internet of Things Spending Guide from IDC, with links to additional IoT trend reports.
On June 14, 2017, IDC announced the findings of its second Worldwide Semiannual Internet of Things Spending Guide, the last one of the year.
A good occasion to see where spending and dynamics with regards to the Internet of Things de facto are going this year (2017) and a further look into the future of IoT as the forecasts now stretch until 2021 and there are some changes to take into account. An overview with additional analysis and context.
Update January 2018: check out the forecasts regarding Internet of Things spending in 2018 with new 2021 forecasts
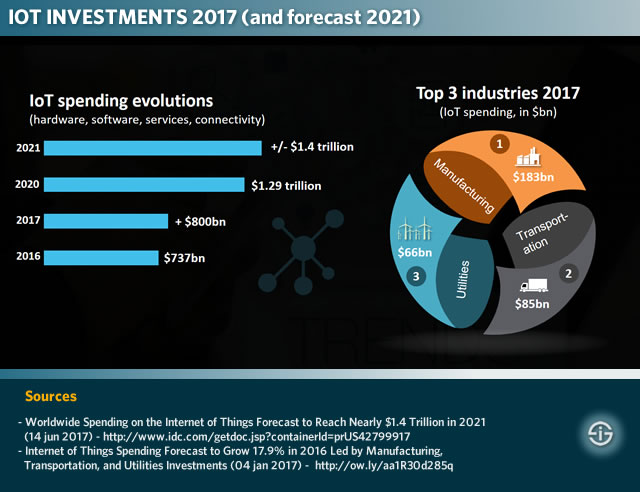
IoT investments: from over over $800 billion in 2017 to nearly $1.4 Trillion in 2021
As a reminder: in the first edition (announced early January 2017) IDC had put manufacturing, transportation and utilities as the main industries from an IoT spending perspective.
Yet, despite the dominance of the industrial IoT and Industry 4.0, consumer IoT spending was poised to take the third spot by 2020 (it was fourth in 2016) and in some countries even sooner, with smart home investments alone reaching over $63 billion by 2020.
Also cross-industry spending was predicted to grow fast (those IoT use cases and spending segments that aren’t related to a particular industry such as any spending with regards to smart buildings). The fastest growth in IoT spending until 2020, however, was for the insurance industry, followed by the consumer market, healthcare and, finally, the retail sector.
So, what does the June 2017 Worldwide Semiannual Internet of Things Spending Guide tell us?
According to IDC, worldwide investments in IoT (software, hardware, services and connectivity) is expected to reach close to $1.4 Trillion in 2021.
By way of comparison: the January 2017 edition foresaw a worldwide IoT spend of $1.29 trillion in 2020. In other words: we seem pretty much on track, certainly when looking at the 2017 patterns below. While the research firm predicted a CAGR of 15.6% on overall IoT spending in the period 2015-2020, for this year (2017) IDC expects a year over year growth of 16.7 percent, which would make overall IoT spending reach slightly over $800 billion. Again by way of comparison: 2016 spending was forecasted to be $737 billion.
From an industry perspective there are no huge surprises but some interesting patterns, among others when looking at use cases within the verticals, nevertheless.
Manufacturing and IoT investment patterns and forecasts 2017-2021
Manufacturing was expected to remain the largest industry from a spending perspective and this hasn’t changed: $178 billion in 2016, an expected $183 billion in 2017 and manufacturing spending in IoT poised to remain highest until 2021 in all 3 largest regions (APeJ, US and Western Europe).
Looking at a manufacturing IoT use case level, manufacturing operations will continue to see the largest spending in 2017 ($105 billion), as it did in 2016 ($102.5 billion). As expected production asset management and maintenance and field service will continue to thrive as well. For 2017, IDC expects that production asset management spending will reach $45 billion.
As per usual we need to remind that, if you look at the major industries from the IoT spending perspectives, these absolute numbers need to be put into context.
It’s clear that the deployment of a connected plant management system, IoT-enabled production robots, an advanced energy management system, cobots in a warehouse or a holistic asset management system, let alone a limited production asset management system to name a few, doesn’t have a similar pricing ticket on the level of all four dimensions (hardware, software, services and connectivity) than, for instance, a smart, connected home deployment.
However, if we want to understand the full impact on IoT spending in manufacturing cross-industry investments such as connected vehicles, smart grid technologies and smart building investments in a factory/warehouse manufacturing scope, as well as freight monitoring (which is a transportation use case for IDC but can start in the manufacturing environment) need to be taken into account as well.
Transportation IoT investments: regional differences
As mentioned, transportation was identified as the second largest IoT investor in 2016 and for the years ahead with a total spend of $78 billion in 2016. For 2017 the new IDC forecast expects a total spend of $85 billion.
The updated forecast also continues to see freight monitoring as the main IoT use case in transportation with regards to investments: spending is expected to reach $50 billion by the end of 2017.
Although transportation remains a key industry for IoT during the period 2017-2021 IDC identifies regional differences here. In the APeJ region (APac excluding Japan), transportation will be the third most important industry spending-wise while in the US it keeps is second spot. In the APeJ region and Western Europe, utilities are expected to take that second spot.
Smart grid and IoT spending in utilities: large investments but lower than expected?
Utilities is an interesting one as here we see some important evolutions. In 2016 utilities were the third most important industry overall ($69 billion). In 2017, this picture remains. However, with $66 billion, the 2017 IoT spending forecast in utilities for 2017 is lower than in 2016.
The same goes for the main utilities IoT use case, smart grid technologies for electricity, gas and water: a forecasted $56 billion in 2017, compared with $57.8 billion in 2016.
The mentioned regional differences do play a role here: while utilities is poised to rank second in 2021 in ApeJ and Western Europe, it won’t be in the top 3 in the US anymore by then. This is not a coincidence and seems to go hand in hand with the decline in the construction of electric utilities and gas plants in the US.
End 2016, Dodge Data & Analytics predicted a pretty healthy construction market in the US for 2017, especially in single family housing (+12 percent) with an increase of older Millennials (a target group for smart home automation), institutional buildings (+10 percent) and commercial buildings with +6 percent and the “start of several signature office towers” (where smart building management systems and the IoT and building management come more into play) as a driver. Manufacturing plant construction is poised to be back up again with +6 percent after two years of decline and undoubtedly will have an impact on factory management systems, BMS and Industry 4.0 related investments.
Electrical utilities and gas plants, however, are poised to fall a whopping 29 percent (after a steep decline of 26 percent in 2016), Dodge Data & Analytics stated.
Still, in 2017, smart grid will still account for 5.6 percent of the top IoT use cases based on 2017 market share as the chart below shows and smart grid remains important during the forecast period.
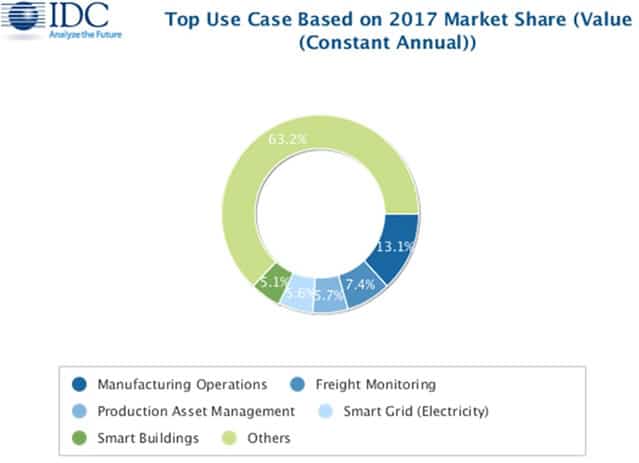
Investments in cross-industry IoT use cases: smart buildings and facility automation
With construction and the mentioned chart we arrived at the main cross-industry IoT use cases. Smart building investments, for instance, are forecasted to make up 5.1 percent of that total top use case spending picture for 2017. Energy efficiency and power management will play a big role here, both in a scope of building management and building automation on one hand and a scope of critical power and connected power for smaller buildings on the other, whereby energy efficiency, ecology and regulations are key aspects.
To summarize let’s take a look at the evolutions in these so-called cross-industry IoT use case. In the announcement about its first 2017 Worldwide Semiannual Internet of Things Spending Guide in January, IDC stated that by 2020, cross-industry IoT use case investments would rank among the top segments with, among others, connected vehicles and smart buildings.
In the announcement of the new report the company states that those cross-industry IoT use cases will reach $86 billion this year (2017) and be the third fastest growing segment until 2021 with a CAGR of 17.6 percent, after insurance and consumer with respectively a CAGR of 20.2 percent and 19.4 percent.
However, and this is new, the IoT use cases with the fastest expected spending growth until 2021 will be airport facilities automation (33.4 percent), electric vehicle charging (21.1 percent) and in-store contextual marketing, which seems like the most obvious use case in retail environments but not just there (a CAGR of 20.2 percent).
The convergence of energy management, building automation, HVAC and services in the smart building
The presence of electric vehicle charging and airport facilities automation is not a coincidence and in more than one sense can be correlated with smart buildings.
As the EU, for instance, is approving directives in the context of climate change, pollution and energy efficiency, more smart building and related environmental regulations are joining the pack. In the new EU rules, specific buildings even need to have electric vehicle charging points, again in that context of ecology.
Expect more focus on energy, climate and pollution, whether the US is in the Paris climate agreement or not. Also expect them in the US by the way.
In many countries premiums and incentives are given in the scope of smart buildings and even smart homes where energy efficiency is also high on the agenda. There is a clear link with large, energy-critical facilities here as well: when airport facilities automation is a high rising use case, it’s important to look at the use cases underneath it. On top of services and all sorts of IoT-enabled innovations as we see them happening in airports across the globe, there most certainly is also an aspect of facility management, building management and energy management (some recent events in airports have added to the awareness regarding the importance of energy monitoring).
The worlds of building automation, energy management, HVAC (Heating, ventilation and air conditioning), smart buildings, environmental technologies, maintenance, new services and so forth are converging very fast in the age of IoT in such types of buildings as airports and hospitals. Electricity, mechanics and OT meet IT in IoT with all the consequences that brings.
More data, regional evolutions and trends per type of investment area (software, hardware, services, connectivity) in the announcement of the June 2017 update or in the full report.
Key data points from the January 2017 report in the press release.