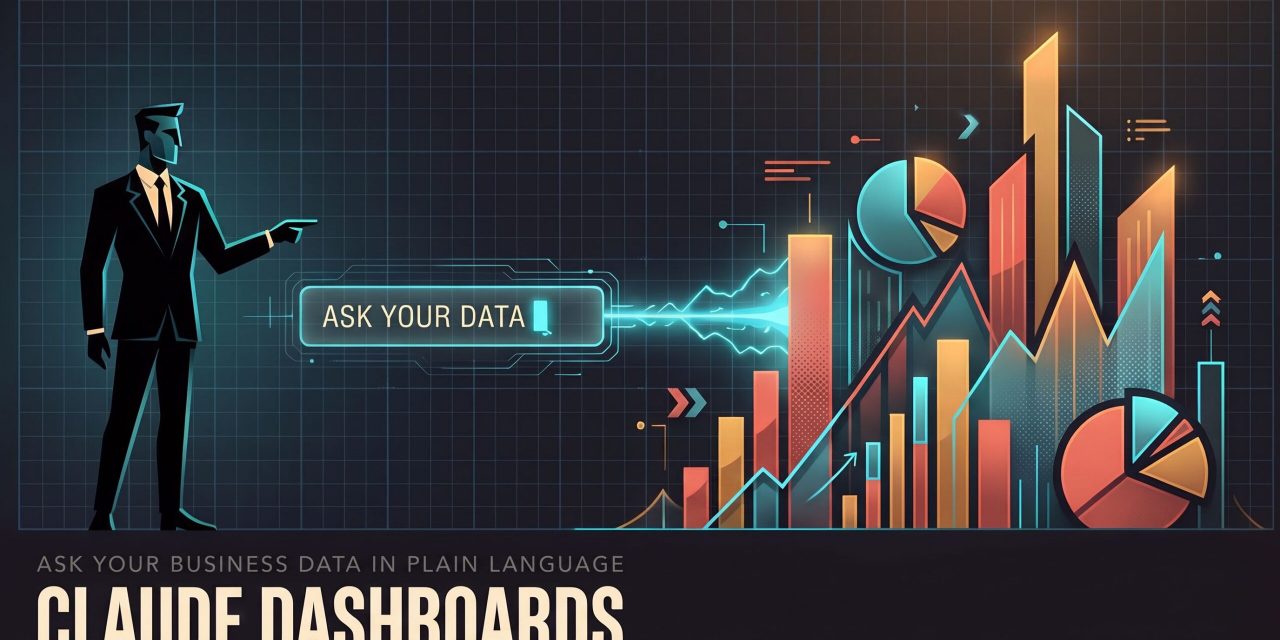
Claude Dashboards lets you type a question about your company’s data and get back a working dashboard. You connect a data warehouse or an app like Salesforce, describe what you want to know, and Claude writes the SQL queries, runs them and assembles the charts. Anthropic released the feature in beta alongside Claude Motion, a month after OpenAI shipped a similar data agent for ChatGPT Work. This guide covers how it works, how to get good results, and where it fits next to your existing BI stack.
How Claude Dashboards works
Every dashboard is an artifact built from the Dashboards template. Artifacts are Anthropic’s name for the documents, decks and dashboards Claude creates, and each one you make is saved in the Artifacts tab.
Behind every chart sits a single SQL query that Claude writes and executes against your data source. That query is visible. Click a number and you see exactly how it was calculated, plus a timestamp showing when the data was last refreshed. If you don’t read SQL, you can ask Claude to explain the figure in plain language. Claude also refreshes the dashboard as the underlying data changes, so you are looking at live numbers instead of a static snapshot.
The intended use case is quick, exploratory analysis. Think of questions like how this week’s signups compare with last month’s, or which region is pulling quarterly revenue up. When a question demands deeper work, you move the dashboard into a dedicated tool and continue there.
Who can use Claude Dashboards
The feature is available in beta on the Pro, Max, Team and Enterprise plans. On Enterprise plans it is switched off by default until an owner enables it. Usage counts toward your plan’s normal limits, the same way any other work with Claude does.
Connecting your data
Before Claude can build anything, it needs access to the data you want to ask about. You have two routes.
- A data warehouse. Supported platforms include Amazon Redshift, BigQuery, ClickHouse, Databricks and Snowflake.
- Apps already connected to Claude. Dashboards work with Claude’s existing connectors, so you can ask for a dashboard of your open Salesforce opportunities without touching a warehouse.
Teams that rely on a semantic layer will want to know that Anthropic plans to support semantic models exposed through a connector. That matters because shared business definitions, such as what counts as an active customer, keep Claude’s numbers consistent with the ones your finance team reports.
Building your first dashboard
You can start a dashboard from any chat. Prompts like these work well:
- “Build a dashboard of this quarter’s revenue by region.”
- “Show weekly signups for the last six months, split by plan.”
- “Make a dashboard of my open Salesforce opportunities by stage and owner.”
There are two other entry points. In the message box you can select Output and pick Dashboards. Alternatively, open the Artifacts tab, choose a Dashboards template and describe what you need.
Ask a question instead of ordering a chart
The single most useful tip from Anthropic’s own documentation is to say what you want to learn. “How do this month’s signups by channel compare with last month’s?” gives Claude a goal, a comparison and a dimension to split on. “A signups chart” gives it almost nothing. Claude then has to guess the time window, the grouping and the metric, and the guess may not match what you had in mind.
It also helps to name the source. If the data lives in a specific table or app, say so. In a warehouse with dozens of similar tables, that one detail can prevent Claude from querying a stale staging table instead of your production model.
Refining and verifying the numbers
A first draft is rarely the final version. You refine dashboards conversationally with requests such as “Add a filter for region” or “Change this to a weekly view.”
The more important habit is checking the query. Open any chart’s SQL to see how Claude arrived at the number. Maybe it counted all signups when you only wanted paid ones, or it used order date where you meant ship date. When that happens, tell Claude what to change and it rewrites the query.
This visible query is what makes Claude Dashboards practical for real business decisions. An AI generated number with no audit trail is hard to trust in a meeting. A number with its SQL attached can be reviewed by anyone on the data team in a few seconds.
Sharing dashboards and handling permissions
New dashboards are private to you. To share one, open it and click Share.
Permissions are handled in a sensible way. An Anthropic spokesperson told The New Stack: “When you share it, each viewer’s own connections run its queries by default, so people see only data they already have access to.” In practice, a sales manager and a regional rep can open the same dashboard and see different results, each limited to the data their own account is allowed to read.
On Team and Enterprise plans, dashboards stay inside the organization unless an owner turns on external sharing. Admins can allow sharing outside the company, including through public links, but that is an explicit choice.
Where dashboards end and BI tools begin
Anthropic positions Claude Dashboards as a fast front door to your data, with specialized BI platforms remaining the place for heavy analysis. When you want to go further, you can export a dashboard to Grafana, Hex, Mixpanel, monday.com, Omni, PostHog or Sigma. Support for Looker, Perplexity and Tableau is planned.
That handoff suggests a realistic workflow. A product manager uses Claude to answer a quick question and discovers something worth tracking. The dashboard then moves into Hex or Sigma, where an analyst turns it into a governed report with proper scheduling, alerts and version control. Claude handles the exploration and the BI tool handles the long term maintenance.
How it compares with OpenAI’s Data agent
OpenAI launched its Data agent as a ChatGPT Work plugin about a month earlier. It connects to Redshift, BigQuery, ClickHouse, Databricks, MongoDB, Snowflake and Datadog, and it can build dashboards directly inside Power BI, Tableau and ThoughtSpot. It already supports semantic layers like Databricks Genie Ontology, and its queries respect the table, row and column permissions of the connected account.
The supported vendor lists differ slightly, but both products follow the same direction. Each company wants a deeper position in the enterprise productivity stack. The warehouse vendors are also active. Snowflake signed a $200 million deal with Anthropic in December 2025, while Snowflake and Databricks both offer their own natural language analytics tools, Snowflake Intelligence and Databricks Genie. For buyers, the deciding factors will likely be which connectors you already use and which AI assistant your team works in every day.
Turning it on for your organization
Owners and Primary Owners on Team and Enterprise plans control the feature in Organization settings under Artifacts. On Enterprise, it starts disabled, and owners can restrict it to specific groups using custom roles. A small pilot with your data team is a reasonable first step, since they can validate queries before the wider company relies on the results.
A few related admin updates arrived at the same time. Artifacts now support customer managed encryption keys, known as CMEK, and admins can choose which artifact templates users see. Docs, Slides and Design have left beta and will be enabled by default for Enterprise organizations on October 15. Claude Motion, which writes code to animate charts and reports into short MP4 clips, is in beta for Team and Enterprise and needs to be enabled separately, just like Dashboards.
The real shift is who writes the first query
Claude Dashboards moves the first draft of an analysis away from the data team and toward the person asking the question. Analysts still matter, but their role changes. They spend less time writing routine queries on request and more time reviewing the SQL Claude produces, maintaining clean table names and defining the semantic models that keep answers consistent. Teams that invest in well documented data will get noticeably better dashboards, because Claude can only be as precise as the tables it reads.