What is Net promoter and how is it used? This introduction to NPS – as a score (it’s also a system) is part one of an in-depth look at NPS, including a few cases. And when we talk about NPS, we have to start with Fred Reichheld.
In our introduction to customer experience we already mentioned Frederick F. Reichheld as the co-author of a paper by Bain & Company (where he works since 1977), “How to achieve true customer-led growth – Closing the delivery gap”. That famous delivery gap showed the difference between the belief of companies regarding the “superior proposition” they offer and the percentage of customers who actually agree.
Surprisingly, the percentages are still used today, even if the paper was published in 2005. Frederick F. Reichheld, or Fred Reichheld for the friends, is probably best known for his work regarding loyalty marketing and the loyalty business model and as the developer of the Net Promoter Score (NPS), a customer loyalty metric (don’t confuse customer loyalty with customer satisfaction) and a registered trademark of Reichheld, Bain & Company and SatMetrix Systems (vendor of the Satmetrix NPX Customer Experience Software Platform).
NPS: the score
NPS is extremely popular in many functional areas: customer service, marketing, contact centers, you name it. NPS is also omnipresent in customer experience management (among others Voice of the Customer or VoC).
The Net Promoter Score is just one – albeit important and probably the best known – piece of the overall Net Promoter System. The essence of the score itself is relatively easy (the more advanced parts and the value and origins of NPS are for later).
Customers are asked to rate on a scale from 0 to 10 how likely they are to recommend a company/service/product to a friend or a colleague.
That’s it, nothing more. But of course the way the metric is used (and which services or products we’re talking about and for which reasons we want to know the score for each of the ones we “measure) matters more. It’s a well-known fact and common sense that no score or metric is perfect and that the context in which it is used matters far more. In reality, numerous companies combine several metrics and scores, for instance to gauge customer service levels, including NPS. NPS is first and foremost about the customer.

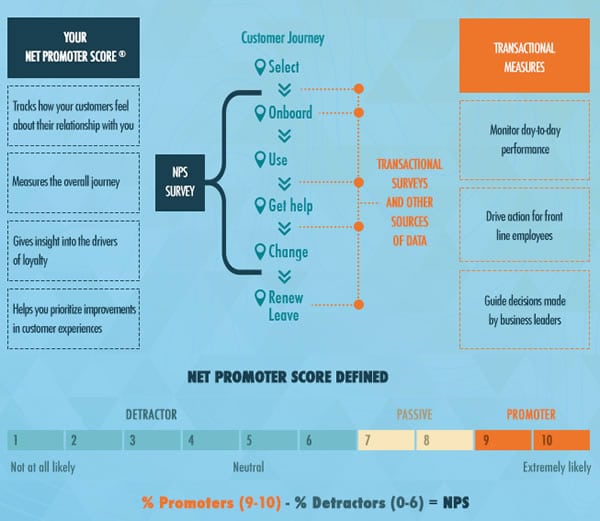
Back to the Net Promoter Score. Depending on the rating of customers answering the “how likely” question (so, from 0 to 10) they are divided into 3 potential groups: detractors, passives and promoters. Before looking deeper into them, here’s a little image from the website of the Net Promoter System immediately showing a simple formula to calculate a NPS score:
% of promoters – % of detractors = Net Promoter score.
NPS: detractors, passives and promoters
So, let’s take a first closer look at each of the three “segments”.
Detractors
These are customers who give a number in the range of 0 to 6. They are not exactly happy. Or, maybe they’re not really totally unhappy, but they sure won’t recommend the “x” in “how likely are you to recommend ‘x’ to a friend or a colleague.
And this is where we need to differentiate and elaborate a bit. As will become crystal clear in the case whereby NPS is used in “real life”, there does not need to be a direct link between a low rate and dissatisfaction. An example: if you often go to a restaurant you love and one day you try a dish you turn out really not to like because it’s not your thing (but you like to try), chance is that when you’re asked whether you would recommend it, you’re in the 0-6 zone. However, that doesn’t mean that you’re not going to come back to that restaurant. Context. It’s just not your thing.
Why NPS?
Research in the nineties and first decade of the new millennium had shown over and over again that customer satisfaction (CSAT) didn’t prove to be the best predictor of customer loyally. NPS turned out to be a better metric but since it was “launched” and became very popular in organizations across the globe, around 2009-2010, many started focusing on the disadvantages and flaws, even if the benefits are huge.
To gauge the impact of “effortless” experiences and customer service on customer loyalty a new system was launched by the CEB: the Customer Effort Score. Many organizations today de facto use or start using a mix of NPS, CES, CSAT and a multitude of other metrics, including proprietary ones.
I was a bit surprised to see that on the website of the Net Promoter System detractors are described as unhappy customers. I guess it’s meant more in general. If you rate a company on a scale of 0 to 6, then you’re indeed unhappy. It’s in this context and in general that detractors have high rates of churn (we don’t renew) and defection (we go away) as the website says. And it’s also here that over 80% of negative word-of-mouth will probably occur indeed too (if you don’t know Fred Reichheld, you might be interested to know that he also is one of the pioneers in word-of-mouth).
Passives
As the word says: these are the rather passive or neutral ones. It’s the group that rated the “recommendation probability” with a score of 7 or 8. They don’t really stand for a “yes, I would recommend” but not for a “no” either.
In that sense they de facto overlap a bit with those in the detractor group who rated anywhere between, let’s say 4 to 6. The only ones that really stand for a total “no” are those who replied with zero.
Promoters
Here you have the customers that are totally positive and would recommend it with 10 of course being the absolutely convinced and satisfied with the company, product or service and a score of 9 being pretty close to that.
At first sight it might seem a bit weird to only use the detractors and promoters co calculate the NPS score. After all, isn’t a score of 8 very close to 9? And isn’t a score of 6 very close to 7? Why have the inventors of NPS excluded the passives from the formula of the score? And, maybe most important, isn’t such a way of ranking a company, product or service a very individual thing?
Look at it this way: imagine you go to the same restaurant I mentioned earlier with some friends and, although it’s impossible as experiences are so individual, as are people, everyone really loves the dish. In this situation it’s very probable that some will rank the likelihood of recommending it with an 8 while others score 9 or 10, even if they would all equally be satisfied and happy. Some people just never give a 10 to anything while for others 10 is the easy answer and, still others, find 8 an excellent score.
The NPS methodology: context matters
It won’t come as a surprise that the 11-point scale methodology (0 is also a point) is one of the subjects of criticism regarding NPS. The ways people rank are individual and contextual. They can be determined by upbringing, personality, industry, types of businesses/services/products and, indeed, culture.
Some examples.
The broader context matters.
Have you ever been with friends to a restaurant with friends during a holiday, laughing, having a few drinks and finding the dish totally great and then later returned with others in another setting (not your best friends, less drinks maybe, no holiday, a bit stressed or in a bad mood or whatnot) and found yourself surprised you didn’t think that exact same dish didn’t strike you as great as the first time? I have. The mood of the waiter, the music that’s playing in the background, the number of people in the restaurant and so many other contextual elements: they all play a role.
The personal background and context matters.
Someone who is used to go to very good restaurants regularly is likely to score a dish lower than someone who isn’t used to go to restaurants at all and for the very first time experiences excellent cuisine and is totally wowed by that dish. What does it say about the dish itself though? Another personal contextual element: some of us are perfectionists and will rarely rate something with a 10 while others might be less perfectionist or simply more enthusiastic and easier satisfied and go for a 10 more often.
The industry.
How do you perceive your overall experiences with let’s say, the contact center of your mobile operator or the operator as such, compared with the quality of the smartphone you bought with your mobile telephony plan? Is it possible that you would rate the quality (and likelihood of recommendation) of your smartphone differently if you bought it from a retailer you have positive experiences with as compared with your operator with whom you have less positive experiences (as we often tend to in this particular industry)? Think about it.
Culture.
It’s a well-known fact that in some countries and cultures there seems to be a difference in mentality regarding giving a 10, for instance. There has been research about that, loads of it in fact. And, while it’s fair to say this affects scores, it’s equally fair to say that in the end it often also is based on different usages of NPS in some cases. So, while it’s not really conclusive, segmenting scores is not a bad idea. You can find lots of debates, findings and discussions about the impact of culture and region.
End 2012, customer experience expert Bruce Temkin was asked about it as well after having published one of his benchmarks of Net Promoter Scores in the US (you know the issue with benchmarks) and seemed to find some differences throughout the US (with NPS highest in the South and lowest in the West). Imagine global benchmarks. I’m sure you know how different the cultures are across the globe and the impact of culture and even religious backgrounds and traditions have a deeper impact than is often understood. Remember your sociology classes.
The perfect customer experience score?
There is no such thing as the perfect score. Furthermore, so called single-question customer metrics such as NPS and CES are pretty risky as the context matters and customer experience is far more than about a single question. It’s a complex given and, more important than the score is the insight and action. Read more.
Anyway, segmenting NPS scores based on, for example, country, service levels, age groups, repeated business or whatever is interesting for your goals in general can be interesting to find any potential differences that matter (again, depending upon the goal).
However, NPS – as a score – is not just to know the likelihood of recommendation in the here and now when you start using it. It’s first and foremost a score that enables you to benchmark your today in order to improve for tomorrow as well. And, although there most certainly is criticism (more than mentioned here) having a basis to improve is exactly what we try to achieve. We want those 9 and 10 scores up and detractors down.
Some Net Promoter Score takeaways
NPS is still used as the main customer loyalty measurement “metric”, system and predictor on effect. It has its shortcomings and benefits and it’s not perfect as nothing is. But it works for many many companies despite the occasional argument and research against it. What matters is how you use it and for what goals.
In order to use NPS properly, you need some form of standardization within your organization to compare the right things. If you just look at the simple formula, ask the wrong questions and don’t take some parameters into account or start comparing apples and oranges across divisions or countries (for instance by deciding 8 is a promoter), you end up having problems.
Sidenote: there have been efforts to standardize NPS as such. One of them is the Standardised Net Promoter Score SNPS.09, launched by CustomerGauge (one of many customer feedback software vendors working with NPS, CSAT etc.). The essence of this challenge is well described in this (older) article of CustomerGauge, called “Who Surveys The Surveyors?”. The title says it all.
NPS as a journey, process and system
As mentioned, NPS is not just a score. Furthermore, scores are meaningless if we aren’t clever about how we use them and what’s the reality behind them. Simple one-question metrics don’t cut it.
To understand the Net Promoter System, the involved processes and Net Promoter as a journey, we need to look at the different steps involved. And the score/metric is just a small part of that overall equation.
Bain & Company defines the Net Promoter System as “a way of doing business”. It first and foremost focuses on customers (and employees). On top of a systematic approach, the Network Promoter System also comprises several processes. As you can read here and see in the graphic below, there are eight Net Promoter processes.
We take a look at Net Promoter as a system, process and journey in a second article with visual illustrations in this introduction to NPS.
NPS in action: a case
Belgium-based yet internationally active Kinepolis Group has added NPS to its Customer Satisfaction Index many years ago.
It uses NPS as part of the overall CSI to look at the brand, individual products (in this case movies and streaming content it shows in its movie theaters, really “multiplexes”) and even now and then for other reasons (e.g. 3D movies).
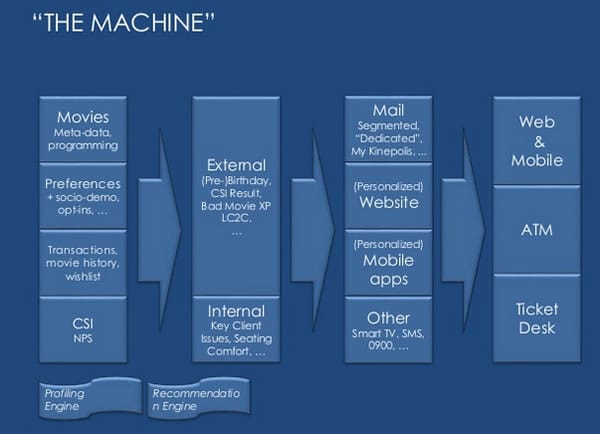
NPS is deeply rooted into the company’s overall CRM and digital marketing approach and an essential part of its recommendation engine.
Net Promoter® and NPS® are registered trademarks and Net Promoter Score and Net Promoter System are trademarks of Bain & Company, Satmetrix Systems and Fred Reichheld.